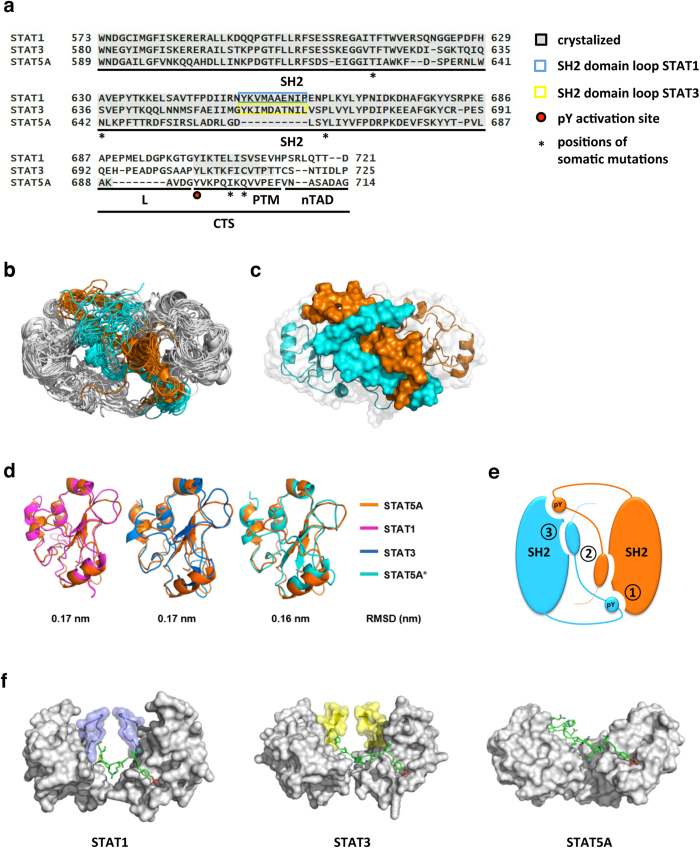
Figure 1. MD simulations of the STAT5A dimer interface.
(a) Multiple sequence alignment of STAT1, STAT3 and STAT5A. SH2 domains and C-terminal tail segments (CTS) consisting of linker (L), phosphotyrosine motif (PTM) and the N-terminal part of the transactivation domain (nTAD) were aligned using the structure-guided alignment mode of T-coffee56. Crystalized regions are marked with grey background. The conserved phosphorylation site for activation of STAT proteins is highlighted by a red dot. SH2 domain loops contributing to dimerization of STAT1 and STAT3 are depicted in blue and yellow boxes, respectively. Positions of disease-related STAT5 mutations are indicated by asterisks. (b) Overlay of 20 frames (every 100 ns) of the MD simulations of the STAT5A dimer interface (top view). Grey: SH2 domains and L of monomer 1 (M1) and monomer 2 (M2). The PTM and nTAD (residues: 694–714) of monomers M1 and M2 are depicted in cyan and orange, respectively. (c) Most representative structure of the STAT5A dimer interface (top view) identified by cluster analysis over the equilibrated trajectories, ranging from 1500 ns to 2000 ns. SH2 domains and L are depicted as ribbon structures with transparent surface representation. PTM and nTAD are depicted as surface representation. Cyan: M1, orange: M2. (d) Superposition and root-mean-square deviation (RMSD) values between the most representative model of the activated STAT5A SH2 domain (M2, orange) and the SH2 domains of the crystal structures of activated STAT1 (pink)/STAT3 (blue) and inactivated (*) STAT5A (cyan) 23–25. (e) Cartoon of the STAT5A dimer interface. Interactions are established by three distinct interfaces involving intermolecular PTM-SH2 domain interactions (1), intermolecular PTM-PTM interactions (2) and intramolecular PTM-SH2 domain interactions (3). M1 and M2 are depicted cyan and orange, respectively. (f) Switch from inter- to intramolecular interactions in SH2 domain interfaces of STAT1, STAT3 and STAT5A (side view). SH2 domains are depicted as surface representation (grey) with SH2 domain loops colored in blue (STAT1) and yellow (STAT3) (compare Fig. 1a). The course of a single PTM of each dimer interface is shown in stick representation (green). Atoms color code: Green, carbon; red, oxygen; blue, nitrogen; orange, phosphorus; yellow, sulfur.

