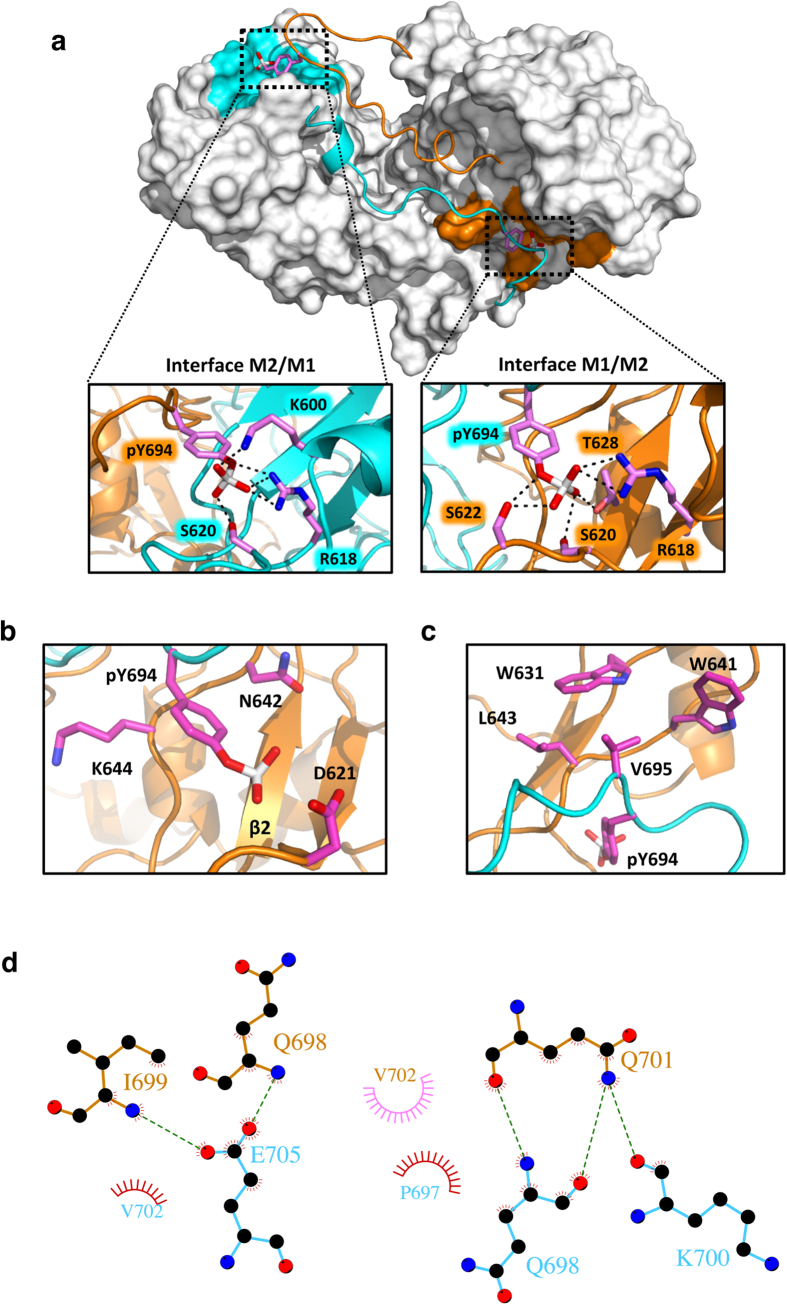
Figure 2. The phosphotyrosine-SH2 domain interface of STAT5A.
(a) STAT5A dimer interface (top view). The SH2 domains are depicted in surface representation colored in grey, while the C-terminal part of the L, the PTM and the nTAD are shown as ribbon structure in cyan (M1) and orange (M2). The phosphotyrosine acceptor interfaces are highlighted in cyan (M1) and orange (M2). The side chain of pY694 is shown in stick representation. A magnification of the phosphotyrosine-SH2 domain interaction is shown for both interfaces. Selected residues are shown in stick representation. Side chains involved in pY694 coordination are depicted in magenta (carbon). Red, oxygen; blue, nitrogen; white, phosphorus. Residue labels are colored in cyan or orange according to the corresponding monomer. Hydrogen bonds are indicated by dashed lines (See also Supplementary Fig. 2 and Supplementary Table 2). (b) Magnification of the hydrophobic phosphotyrosine-SH2 domain interactions in M2. Residues involved in the coordination of phosphotyrosine 694 are shown in stick representation. N642 and K644 form direct hydrophobic contacts with the phenyl ring of phosphotyrosine. D621 localizes in close proximity to the phosphate group. The coloring scheme is the same as in (a). (See also Supplementary Fig. 2 and Supplementary Table 2). (c) Magnification of the V695-binding interface (pY+1) in the SH2 domain of M2. Residues forming hydrophobic contacts (W631, W641 and L643) with V695 are highlighted in stick representation. The coloring scheme is the same as in (a). (See also Supplementary Fig. 2). (d) Schematic, 2D representation of the STAT5A PTM-PTM interface generated by the LIGPLOT+ package57. Hydrophobic interactions (red, M1; pink, M2) and hydrogen bonds are indicated by spokes and dashed green lines, respectively. The residues forming hydrogen bonds are shown by ball-and-stick representations (cyan, M1; orange, M2).

