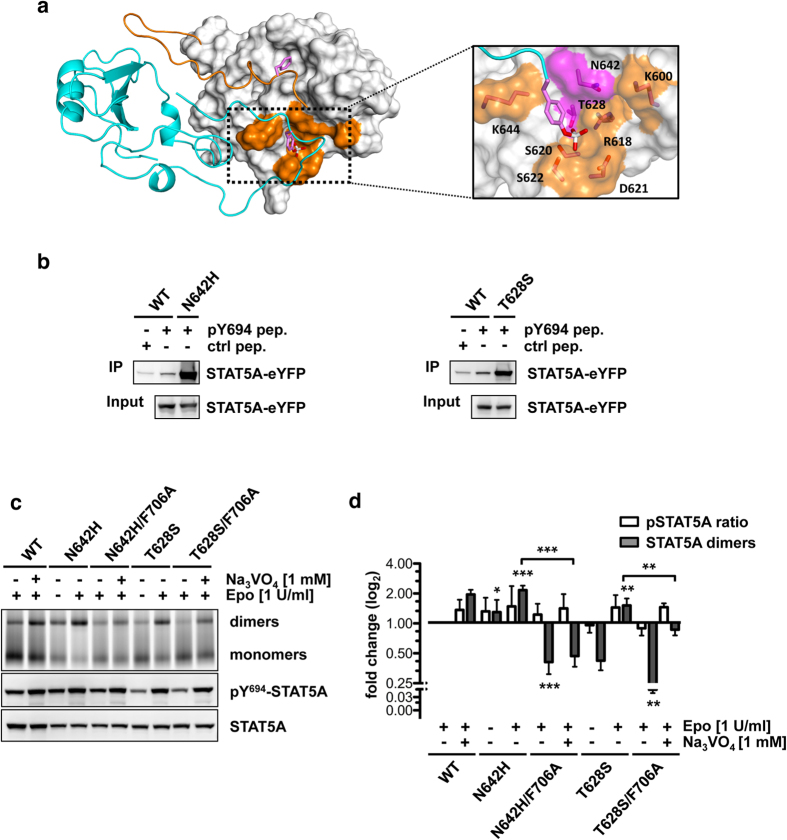
Figure 4. STAT5A mutations N642H and T628S cause constitutive activation and remain susceptible to F706 substitution.
(a) STAT5A dimer interface. Monomer 1 is depicted as ribbon structure (cyan). The SH2 domain of monomer 2 is shown in surface representation (grey) with the CTS (res. 690–707) depicted as ribbon structure (orange). Side chains of pY694 and F706 are shown in stick representation. Magenta, carbon; red, oxygen; white, phosphorus. The phosphotyrosine-SH2 domain interface is magnified and residues contributing to phosphotyrosine-binding are shown in stick representation and orange surface color. Mutation-sites N642 and T628 are highlighted in magenta. (b) Peptide precipitation assay using WCLs of HeLa T-REx FRT cells expressing STAT5A-eYFP, STAT5AN642H-eYFP or STAT5AT628S-eYFP. Lysates were incubated with biotinylated control (F694) or phosphorylated (pY694) STAT5A peptides coupled to NeutrAvidin-Agarose. Precipitates and WCLs were analyzed by immunoblotting using a GFP-specific antibody. (c) Native PAGE analysis of WCLs of HeLa T-REx HA-EpoR cells stably expressing STAT5A-eYFP or STAT5A mutants, treated with sodium vanadate (1 mM, 1.5 h) and/or Epo (1 U/ml, 30 min) as indicated. The native gel was analyzed by fluorescence scanning for the detection of YFP-tagged proteins. WCLs were subjected to immunoblotting using antibodies against pY694/699-STAT5A/B and GFP. (d) Quantification of native PAGE experiments. Normalized STAT5A dimerization levels and normalized pSTAT5/STAT5A ratios relative to stimulated cells expressing wild-type STAT5A were plotted. The data shown represent geometric means ± 95% confidence intervals of n = 4 independent experiments statistically evaluated by a paired ratio t-test with ***p < 0.005, **p < 0.01 and *p < 0.05.

