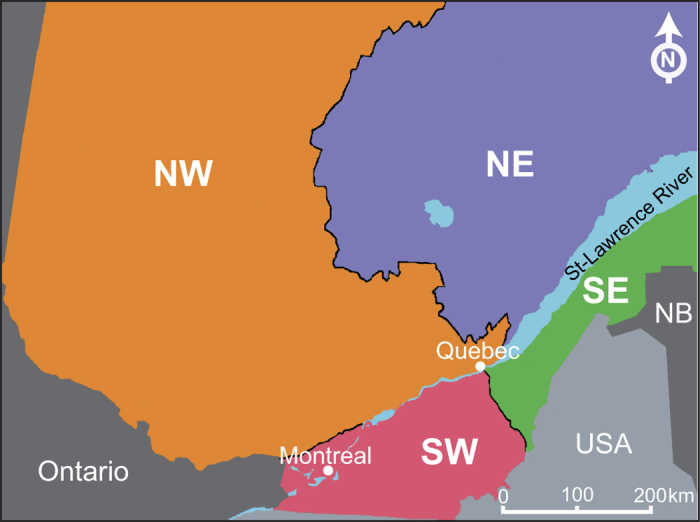
Figure 4. Map of the Quebec showing the regions to which the various isolates were assigned.

Northwest (NW, orange), northeast (NE, purple), southwest (SW, pink), and southeast (SE, green). Most of the fish farms analyzed were less than 200 km from the St. Lawrence River, which crosses the province from west to east. The map has been drawn using Adobe Photoshop CS4 version 11.0.2 (www.adobe.com).
