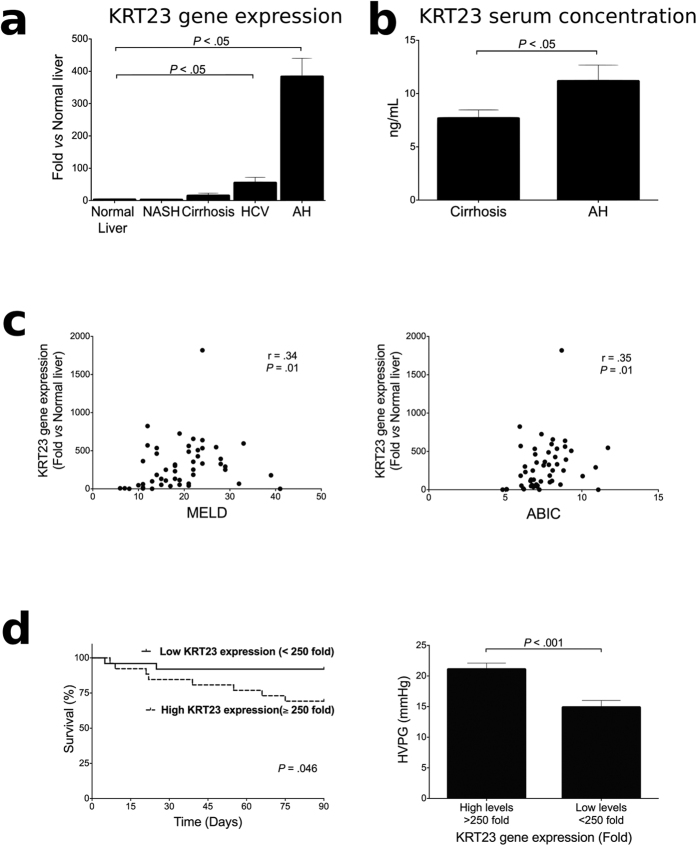
Figure 3. KRT23 expression correlates with disease severity and key features of AH.
(a) KRT23 hepatic gene expression measured by qPCR in patients with AH (n = 51), HCV (n = 10), compensated cirrhosis (n = 10) and NASH (n = 14), compared to normal livers (n = 7). (b) KRT23 peripheral serum levels are elevated in patients with AH (n = 34) when compared to patients with cirrhosis (n = 14). (c) Correlation between KRT23 hepatic gene expression (fold change vs. normal livers) and clinical features in patients with AH (n = 51). Both MELD score as well as ABIC score correlated with KRT23 hepatic gene expression. (d) Kaplan-Meier’s curve analysis illustrates the relationship between KRT23 hepatic gene expression with 90-day mortality in patients with AH. A cut-off value of 250-fold expression (fold change vs. normal livers) defined patients with low and high KRT23 gene expression with the best sensitivity and specificity. Portal hypertension (hepatic venous pressure gradient – HVPG – mmHg) was higher in patients with higher KRT23 gene expression levels (>250-fold).

