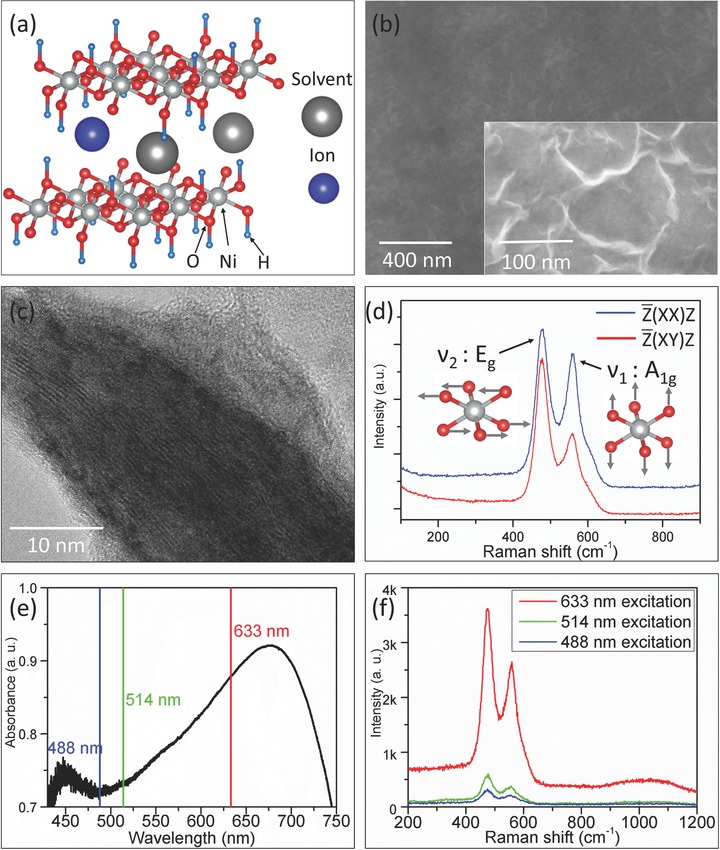
Figure 1.

a) Schematic sketch of NiO2Hx layered structure showing bonded hydrogen and interlayer species (ions and solvent molecules). b) Scanning electron microscope (SEM) images of NiO2Hx thin film model electrode. c) TEM image of the scraped NiO2Hx thin film, d) Raman spectra of NiO2Hx thin film model electrode under and polarization configurations. The corresponding band assignments (Eg and A1g) and the sketches of the two bands are also shown. e) UV–vis absorption spectrum of NiO2Hx thin film model electrode marked with available excitation laser wavelengths. f) Raman spectra of NiO2Hx thin film model electrode using different excitation lasers with equivalent laser power of 4 mW.
