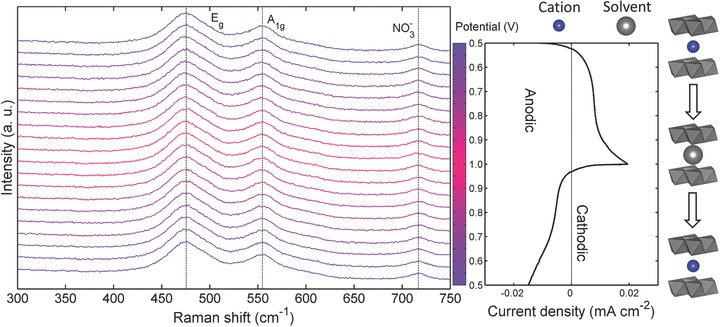
Figure 3.

In operando Raman spectroscopic evolution of NiO2Hx thin film model electrode operated in a 2 m KNO3 aqueous electrolyte. The corresponding CV profile (10 mV s−1) is shown on the right panel. The potential of each spectrum is indicated by the color bar located between the spectra and the CV curve. The color bar is separated to 20 grids. Each grid represents a potential interval of 0.05 V, over which, the spectrum was acquired during the in operando measurements. A schematic sketch of interlayer cation insertion/extraction is also shown to illustrate the redox behavior in KNO3 electrolyte on the basis of quantitative analyses.
