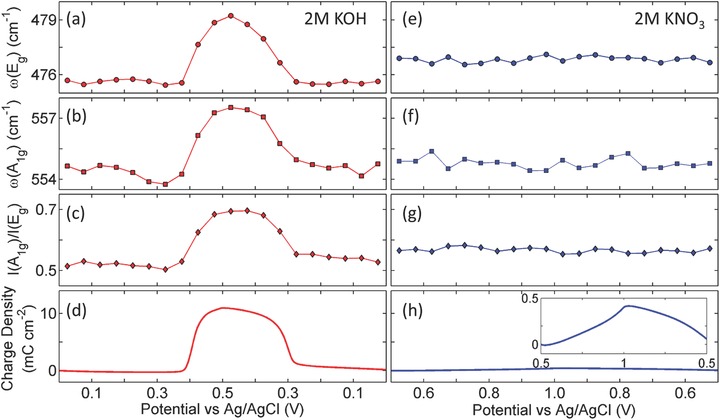
Figure 4.

Quantitative correlation between key spectroscopic features and stored charge density of NiO2Hx model electrode when 2 m KOH and 2 m KNO3 were used as electrolyte. a–d) The energy of Eg mode (i.e., ω(Eg)), energy of A1g mode (i.e., ω(A1g)), intensity ratio of A1g and Eg (i.e., I(A1g)/I(Eg)), and stored charge density as functions of WE potential when KOH was used as electrolyte, respectively. e–h) The values of ω(Eg), ω(A1g), I(A1g)/I(Eg), and stored charge density as functions of WE potential when KNO3 was used as electrolyte, respectively.
