
Figure 3.
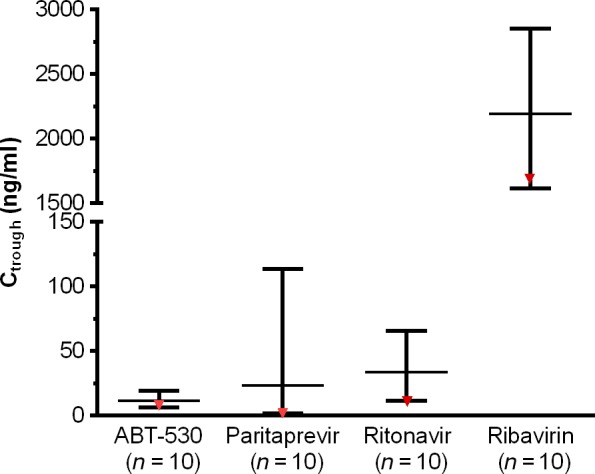
Distribution of trough plasma concentrations measured for patients who received ABT‐530 in combination with paritaprevir/ritonavir and ribavirin for 12 weeks. Presented is the distribution of trough plasma concentrations for the 10 patients who received ABT‐530 in combination with paritaprevir/ritonavir and ribavirin for 12 weeks. The middle line indicates the mean value, and top and bottom lines show the maximum and minimum values, respectively, for each compound. Data for the patient who experienced virological failure at treatment week 6 are indicated in red. Ctrough, trough plasma concentrations, is estimated based on concentrations measured at 22–26 h post dosing for ABT‐530, paritaprevir and ritonavir and at 10–14 h post dosing for ribavirin.