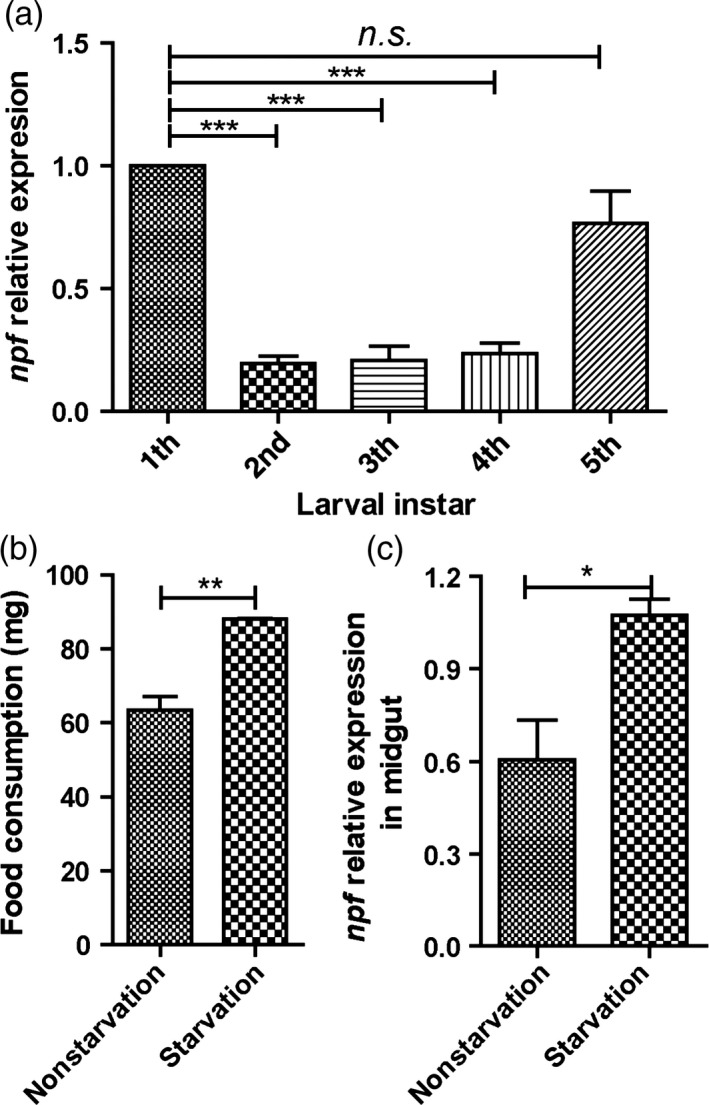
Figure 2.

Relative expressions of Harmnpf at larval instar and effects of starvation treatment. (a) The relative expression level of Harmnpf at different larval instar stages (n = 30). n.s., no significant difference. (b) One‐hour food consumption after 24‐h starvation or no starvation. (c) The NPF relative expression levels after 24‐h starvation treatment or no starvation (n = 10). All data are expressed as the mean ± SD of three replicates. Differences at ”*”P < 0.05, ”**”P < 0.01 and ”***”P < 0.001.
