Figure 5.

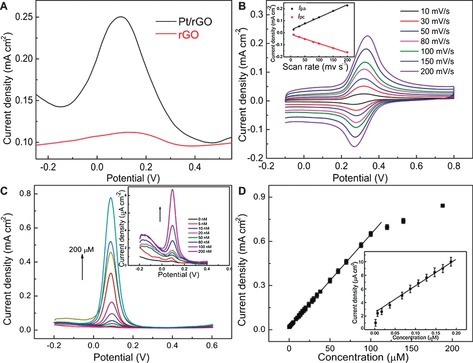
A) DPV curves of rGO and Pt/rGO paper electrodes in PBS (0.1 m, pH 7.4) containing DA. B) CVs of the Pt/rGO paper electrode at different scan rates in PBS (0.1 m, pH 7.4) containing 10 μm DA. The inset shows the dependence of redox peak current density on the potential sweep rate. C) DPV responses to various concentrations of DA at the Pt/rGO paper electrode. The inset shows DPV curves at low concentrations of DA. It should be noted that not all of the curves at different concentrations are shown for the sake of clarity. D) Relationship between DPV current density and DA concentration. The inset shows the equivalent plot for low concentrations of DA.
