
Figure 2.
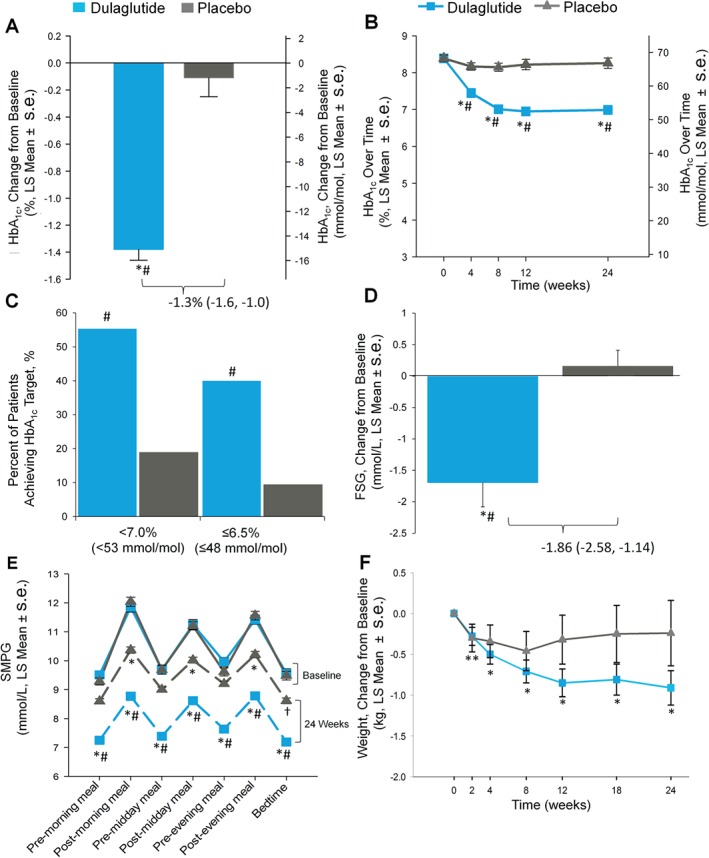
Trial outcome measures: (A) Change in glycated haemoglobin (HbA1c) from baseline at week 24, intention‐to‐treat (ITT) without post‐rescue values [mixed model for repeated measures (MMRM)], *p < 0.001, change from baseline; #p < 0.001, dulaglutide versus placebo. (B) HbA1c values change from baseline over time to week 24 (MMRM), *p < 0.001, change from baseline; #p < 0.001, dulaglutide versus placebo. (C) Percentage of patients achieving HbA1c targets, ITT, without post‐rescue values, Logistic regression, #p < 0.001, dulaglutide versus placebo. (D) Change in fasting serum glucose concentrations from baseline to week 24 (central laboratory) ITT without post‐rescue values analysis of covariance (LOCF) *p < 0.001, change from baseline; #p < 0.001, dulaglutide vs placebo. (E) Seven‐point self‐monitored plasma glucose (SMPG) by time of day, ITT without post‐rescue values (MMRM), *p < 0.001, †p < 0.050, change from baseline; # p < 0.001, dulaglutide vs placebo. Solid lines indicate baseline, dashed lines indicate endpoint data. (F) Body weight change over time from baseline to 24 weeks, ITT without post‐rescue values (MMRM), dulaglutide change from baseline **p < 0.050, *p < 0.001. LS, least‐squares; s.e., standard error.