
Figure 2.
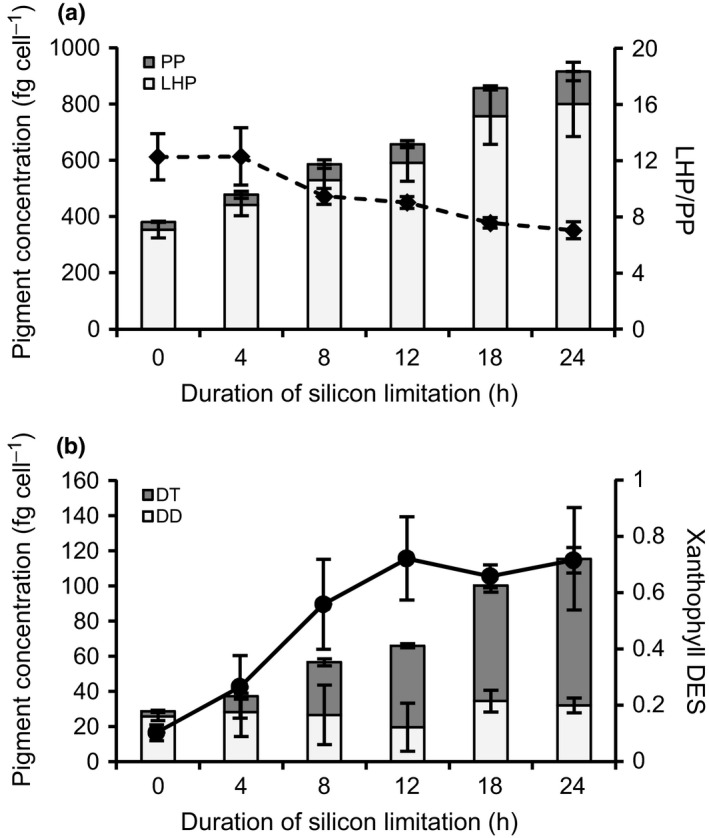
Cellular pigmentation changes during silicon starvation in Thalassiosira pseudonana. (a) Pigment concentrations per cell shown as light‐harvesting pigments (LHP; Chla, Chlc, fucoxanthin) and photoprotective pigments (PP; diatoxanthin and diadinoxanthin) are plotted and represent the average of technical duplicates from Si– #5, Si– #6, and Si– #7. The average ratio of light‐harvesting pigments for Si– #5, Si– #6, and Si– #7 is plotted (dashed line). Error bars show ± SD between experiments. Pigment concentrations of xanthophyll pigments diatoxanthin (DT) and diadinoxanthin (DD) (b) are plotted and represent the average of technical duplicates from Si– #5, Si– #6, and Si– #7. The xanthophyll de‐epoxidation state (DES) is plotted and represents the average of technical duplicates from Si– #5, Si– #6, and Si– #7. Error bars show standard deviation between experiments.