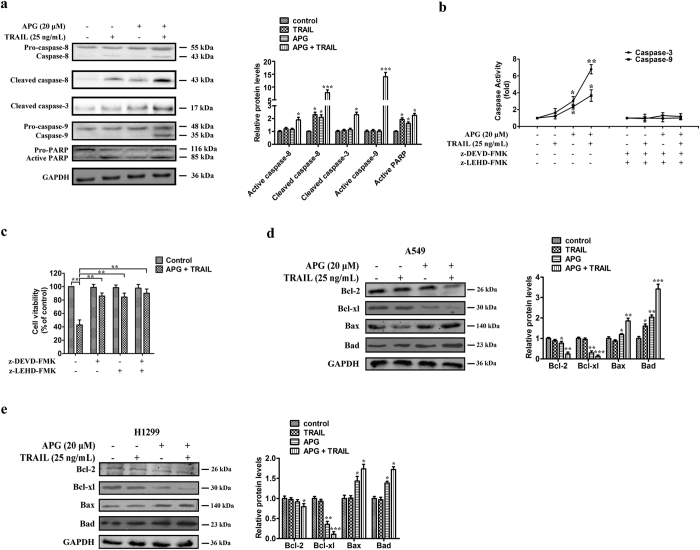
Figure 3. Sensitization of TRAIL-induced apoptosis by APG treatment is mediated through the caspase-dependent mitochondrial pathway in NSCLC cells.
(a) Caspase-8, caspase-9, caspase-3, and PARP expression levels in A549 cells under different treatment conditions. All gels run under the same experimental conditions and the representative images of three different experiments were cropped and shown. Densitometric quantification of the immunoblot data is also shown and data are represented as mean ± SD. *p < 0.05, ***p < 0.001. (b) Activity of caspase-3 and caspase-9 in A549 cells treated with APG and TRAIL alone or in combination for 24 h. Data are presented as fold increases as determined by quantitative analysis. *p < 0.05, **p < 0.01. (c) Viability of A549 cells after treatment with caspase inhibitors. Cells were treated with inhibitors for 2 h before the 24 h treatments, after which cell viability was determined by MTT assay. Data are representative of three independent experiments and are represented as mean ± SD. **p < 0.01. (d,e) Expression levels of the Bcl-2 family proteins, Bcl-2, Bcl-xl, Bax, and Bad, in A549 (d) and H1299 (e) cells under different treatment conditions. All gels run under the same experimental conditions and the representative images of three different experiments were cropped and shown. Densitometric quantification of the immunoblot data is also shown and data are represented as mean ± SD. *p < 0.05, **p < 0.01, ***p < 0.001.

