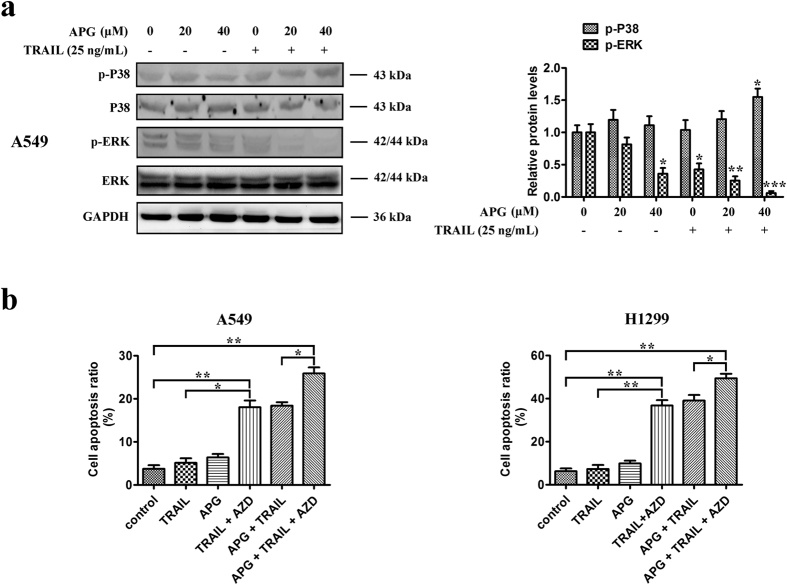
Figure 6. Effects of APG and TRAIL on ERK pathway.
(a) A549 cells were treated with APG at different concentrations (0, 20, 40 μM) in the absence or the presence of TRAIL (25 ng/mL) for 24 h. Western blotting was performed to detect the levels of P38, p-P38, ERK, p-ERK, respectively. All gels run under the same experimental conditions and the representative images of three different experiments were cropped and shown. Densitometric quantification of the immunoblot data is also shown and data are represented as mean ± SD. *p < 0.05, **p < 0.01, ***p < 0.001. (b) A549 and H1299 cells were treated with APG (20 μM), TRAIL (25 ng/mL), AZD6244 (AZD; 2 μM), or their combination for 24 h before determination of cell death by flow cytometry analysis. Data are representative of three independent experiments and are represented as mean ± SD. *p < 0.05, **p < 0.01.

