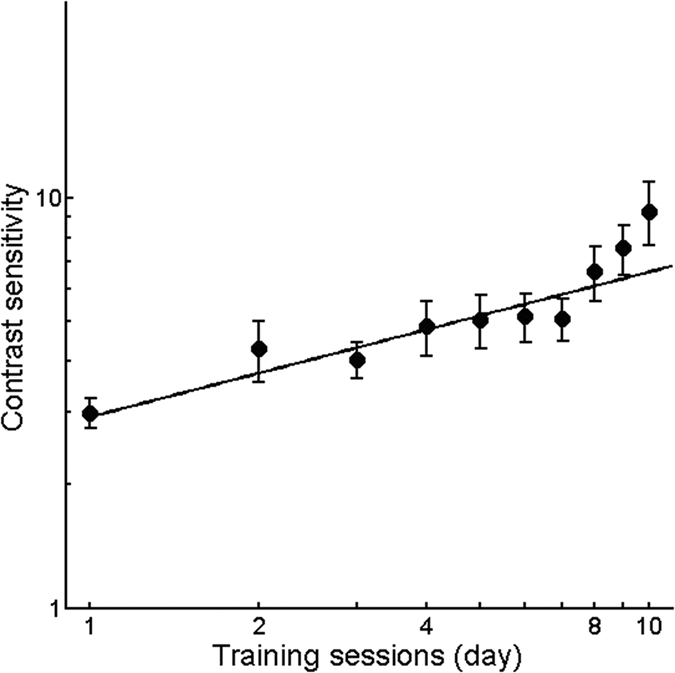
Figure 2. Improvement at the trained spatial frequency after perceptual learning.

The average learning curve for the amblyopic eyes (n = 26) for the first 10 training sessions. The black line represents the best linear fit. The error bars indicate the standard errors across observers.
