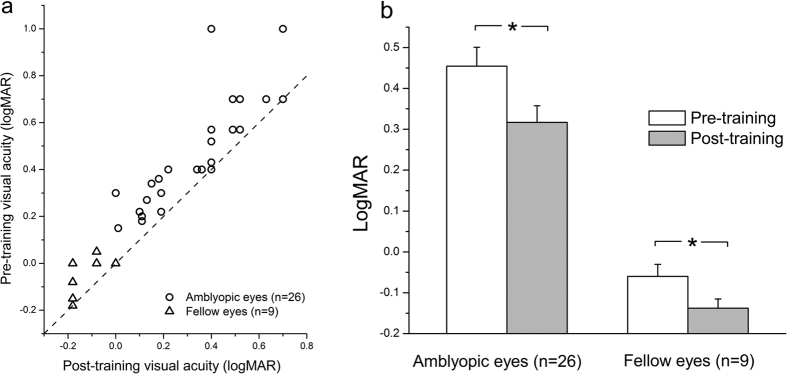
Figure 4. Improvements in VA without AO correction after perceptual learning.
(a) The pre- and post-training VAs of the amblyopic eyes (open circle, n = 26) and untrained eyes (open triangle, n = 9). The pre-training VA is plotted as a function of the post-training VA. The dashed line indicates the prediction of no improvement. (b) The average VAs measured without AO correction before (white bars) and after (grey bars) training in the amblyopic eyes and untrained fellow eyes. The error bars indicate the standard errors across observers; ‘*’ indicates p < 0.05 (2-tailed paired t-test).

