
Figure 4.
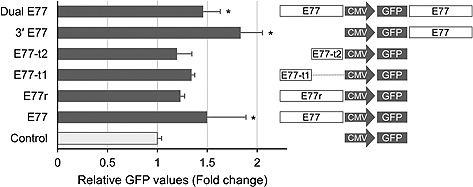
Characterization of E77. The relative GFP values represent the average fold change of median fluorescence intensity in stable cell populations at three weeks after selected cells were cultured under zeocin selection pressure. The right panel shows the vector constructs based on pGIZ, containing various insertions of E77 or its partial sequences. ”GFP“ represents the GFP‐IRES‐ZeoR‐polyadenylation signal sequence. Control, CMV promoter only; E77, the 5'‐flanking region; E77r, the reverse orientation of E77; E77‐t1 and E77‐t2, partial sequences of E77; 3' E77, the 3'‐flanking region; dual E77, both the 5'‐ and 3'‐flanking regions. Bars represent the mean + standard deviation of three independent transfections. *p < 0.05 (One‐way analysis of variance using the Holm–Sidak method).