
Figure 5.
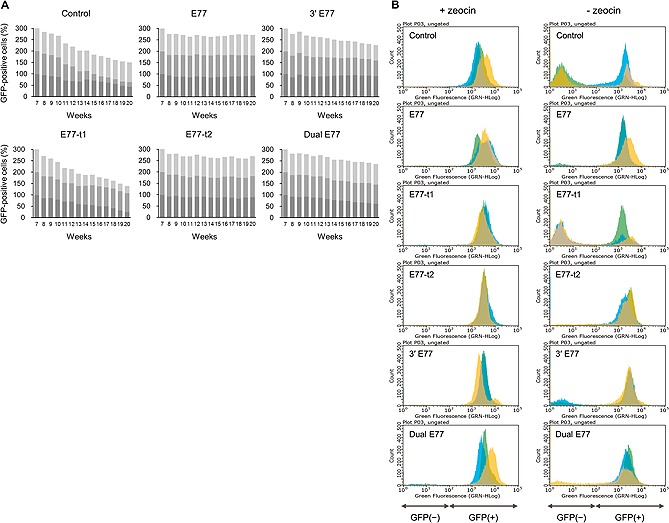
Stable expression of GFP in long‐term culture following removal of selection pressure. (A) The sum of percentages of GFP‐positive cell populations over time in the absence of selection pressure. Three independent stable transfectants in each group at seven weeks were continuously cultured for 13 weeks in the presence or absence of zeocin selection pressure, and sampled at weekly intervals to assess GFP expression by flow cytometry. Different colored bars represent the percentages of GFP‐positive cells in three independent populations in each group. (B) The fluorescence distribution of GFP‐expressing cell populations at 13 weeks in the presence or absence of zeocin selection pressure. Different colors represent three independent populations at the same time point. The x‐axis indicates the GFP fluorescence signal and the y‐axis the relative number of cells. ”GFP(‐)“ and ”GFP(+)“ represent GFP‐negative and positive cells, respectively. Control, CMV promoter only; E77, the 5'‐flanking region; E77r, the reverse orientation of E77; E77‐t1 and E77‐t2, partial sequences of E77; 3' E77, the 3'‐flanking region; dual E77, both the 5'‐ and 3'‐flanking regions.