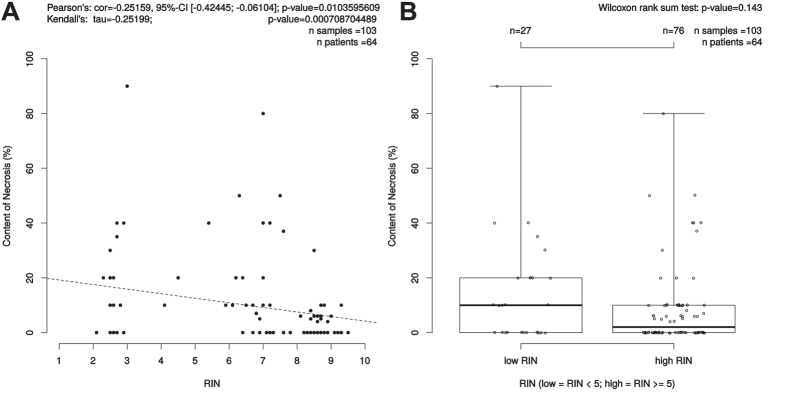
Figure 4. Correlation between content of necrosis (%) and RIN.
(A) Scatterplot: Pearson’s correlation coefficient (r) and due to skewedness of the data also Kendall’s rank correlation tau were depicted as measures. Kendall’s rank correlation yielded a tau of −0.2519935 and had a p-value of 0.0007087. (B) The bimodal distribution of RIN values was the trigger to further investigate the Wilcoxon test results for the low/high RIN classes, which result here in a p-value of 0.143.

