
Figure 7. Kaplan-Meier-Curve displaying the DFS between the excluded and included patients for further molecular analyses.
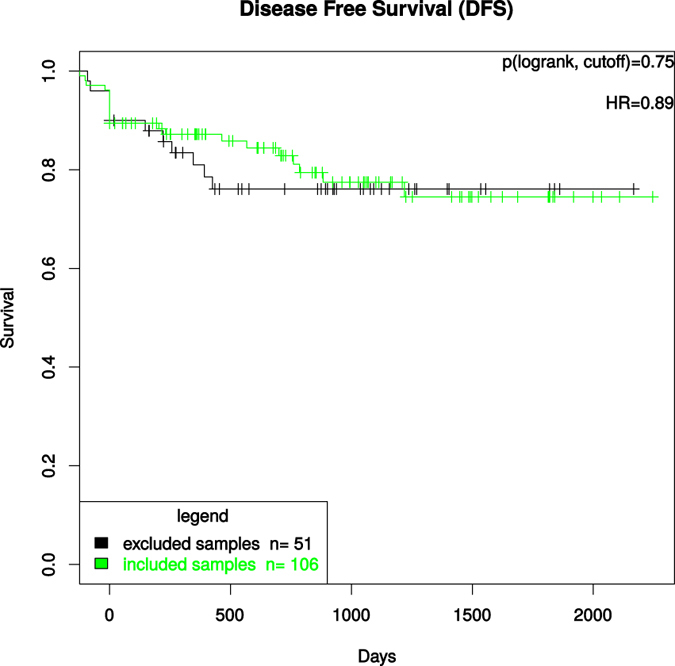
The test used was the log rank test for differences regarding survival in the “excluded samples” vs “included samples” groups, which were defined by cutoffs (tumor content > 50% and RIN > 5).