
Figure 3. Calculated E(J) curve at H = 0: phase slip line branch.
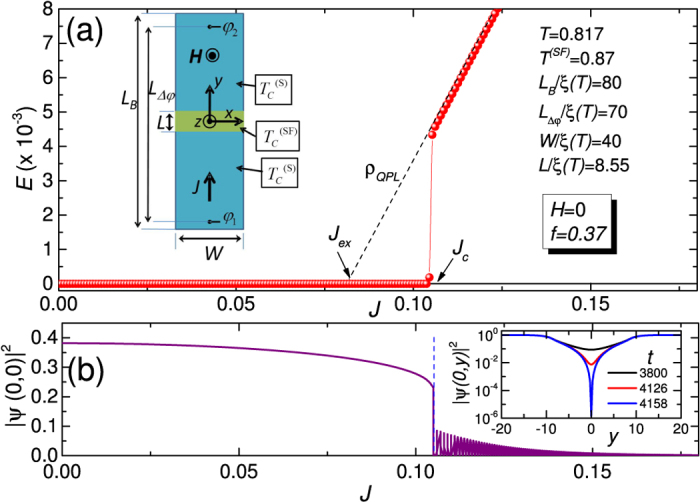
(a) Calculated time averaged electric field versus applied current density, E(J), of the weak link at zero applied magnetic field. In the inset there is shown the geometry used to model the real S/SF/S lateral weak link structure. The used reference frame and parameters of the simulations are also shown. (b) Squared order parameter at the center of weak link versus applied current density at zero applied magnetic field. Above the critical current density Jc the order parameter is oscillating with time. In the inset there is shown the profile of the squared order parameter along y-direction [see inset of panel (a)] at several times when the weak link is polarized on the dissipative branch.