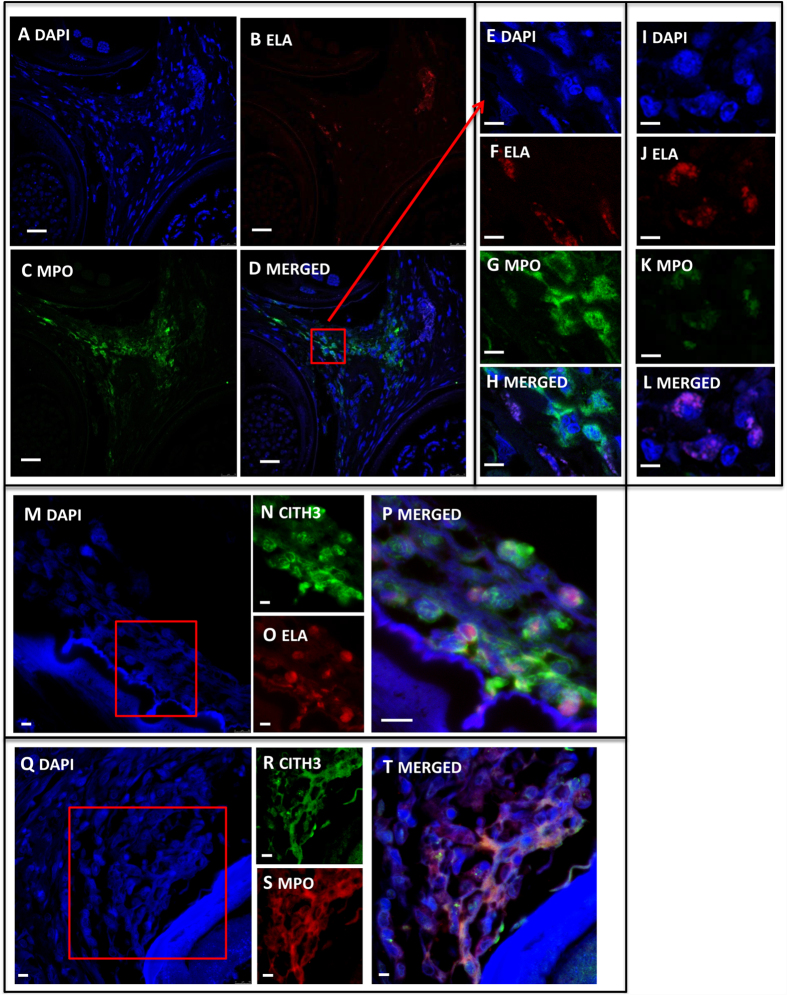
Figure 2. Representative immunofluorenscent histological sections of NETs in placebo treated onchocercomata.
Low-power (50x) magnifications of DAPI (blue; A), neutrophil elastase (ELA, red; B), myeloperoxidase (MPO, green; C), and merged image (D) of a placebo-treated onchocercomata section. High-power (250x) magnifications of DAPI (blue; E), neutrophil elastase (red; F), myeloperoxydase (green; G) and merged image (H) of a specific area of the placebo-treated onchocercomata section from panels A to D (red frame) and showing extracellular release of elatase and myeloperoxidase from activated neutrophils. Conversely, resting neutrophils only displayed intracellular elastase and myeloperoxidase signals (DAPI in blue, elastase in red, myeloperoxidase in green and a merged image in panels I–L respectively). Presence of NETs was confirmed by colocalization of citrullinated histones, DAPI and either elastase or myeloperoxidase signals (panels M to T). High-power (150–250x) magnifications of DAPI (blue, M), citrullinated histones (CITH3, green; N), elastase (ELA, red; O) and merged image (O) of a placebo-treated onchocercomata. Following the same pattern, high-power (150–250x) magnifications of DAPI (blue, Q), citrullinated histones (CITH3, green; R), myeloperoxidase (MPO, red; O) and merged image (T) of another placebo-treated onchocercomata. (A–D) scale bar 100 μm. (E–L) scale bar 20 μm. (M–T) scale bar 50 μm.

