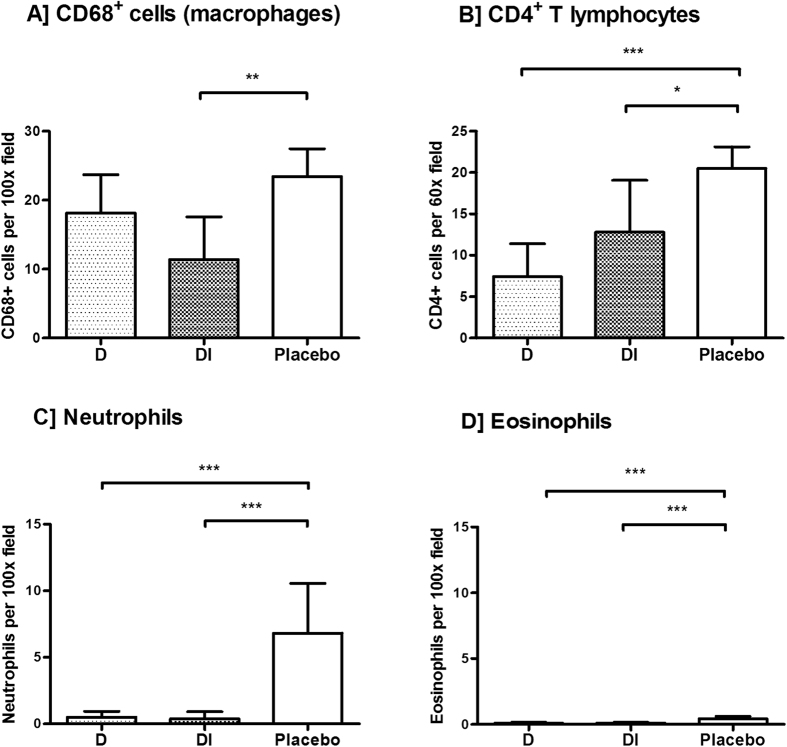
Figure 3. Cell populations in O. volvulus nodules.
Nodules were from patients treated with doxycycline (D, n = 3 nodules), doxycycline + IVM (DI, n = 5 nodules), and placebo (n = 5 nodules). Cells were counted in 20 randomly selected fields of the indicated magnification within the whole nodule section. The distribution of the mean number of cells per field was positively skewed, therefore a Poisson regression model was applied and the corresponding p-value adjusted for clustering of replicates within nodules. Bar graphs represent number of cells (mean ± SD) per field. *p = 0.022; **p = 0.003; ***p ≤ 0.001.

