
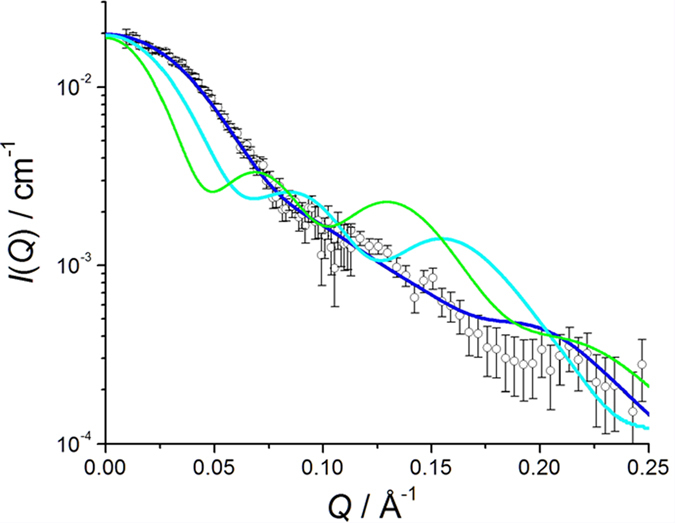
Figure 5. SANS profiles calculated from Model 1 (blue), Model 2 (cyan), and Model 3 (green) along with the experimentally obtained profile (open circle).
Official websites use .gov
A
.gov website belongs to an official
government organization in the United States.
Secure .gov websites use HTTPS
A lock (
) or https:// means you've safely
connected to the .gov website. Share sensitive
information only on official, secure websites.