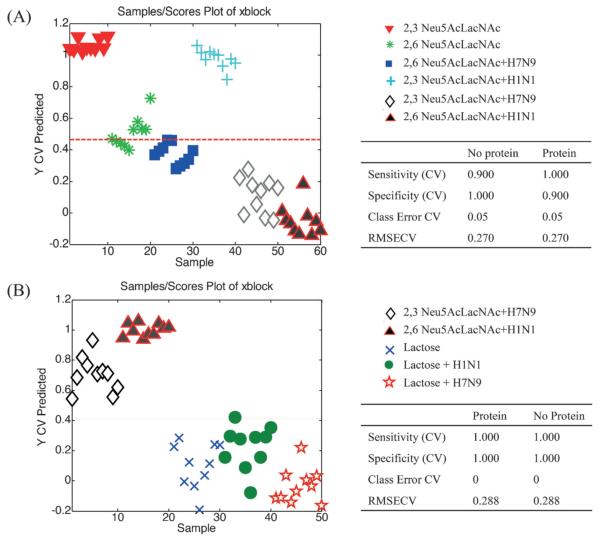
Figure 5.
PLS-DA Y predicted plots and cross-validated results. Each plot predicts a sample as belonging to or not belonging to the specified classes. Classes used to build the model (A) were two forms of sialylated LacNAc and the addition of two HAs (50 μg mL−1). Classes used to build the model (B) were two HAs, lactose and lactose + HAs. The defined classes were protein and no-protein.

