
FIG 2.
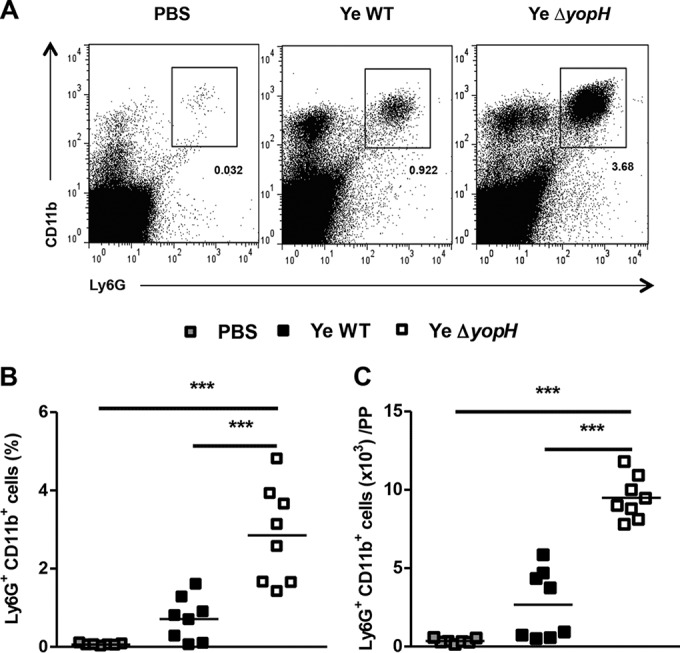
Neutrophil infiltration in PP following Y. enterocolitica WT or Y. enterocolitica ΔyopH infection. C57BL/6 mice were infected orally with 5 × 10⁸ CFU of Y. enterocolitica WT strain or ΔyopH mutant strain. Control mice received PBS. Cells were collected from Peyer's patches (PP), stained for the neutrophil markers Ly6G and CD11b, and subjected to flow cytometry analysis. (A) Representative dot plot showing analysis of neutrophils in PP from control (PBS) and Y. enterocolitica WT- and ΔyopH-infected mice. The numbers in the plots indicate the percentages of labeled cells. Percentages (B) and absolute neutrophil numbers (C) in the PP of mice at day 3 after infection with WT or ΔyopH strains are presented. The data in panels B and C are the summary results of 3 experiments. Each symbol represents an individual mouse; horizontal lines indicate the means; ***, P < 0.001.