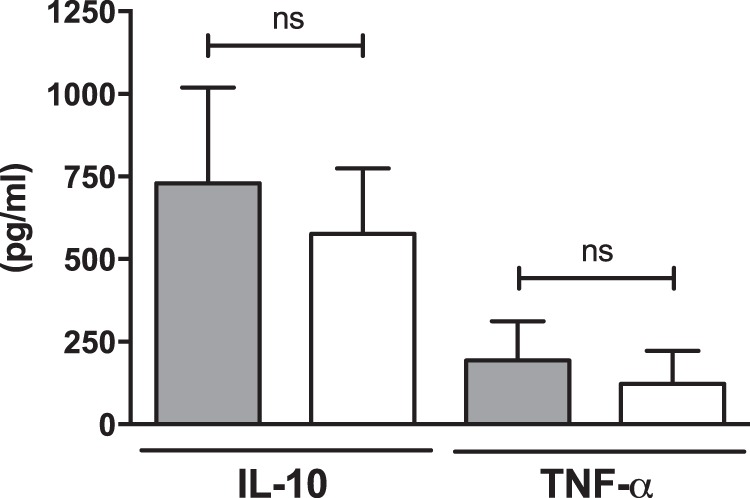
FIG 4.

IL-10 and TNF-α production of mouse gallbladder samples infected with either the WT (gray bars) or WT+ViAg (white bars). Each bar consists of the combined data from 10 separate samples. Error bars indicate standard errors. ns, not significant.
