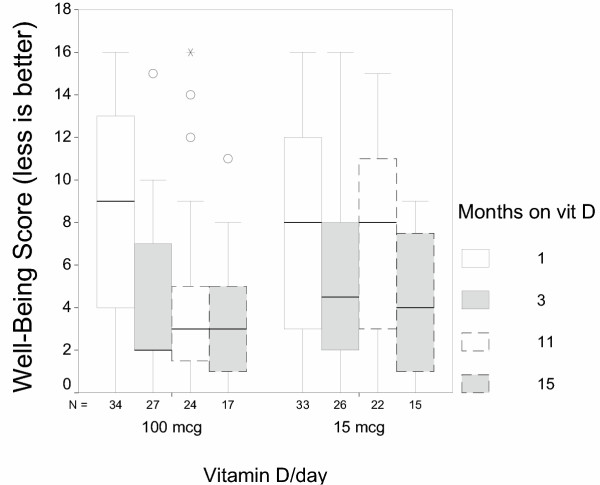
Figure 3.
Cross-sectional presentation of the effect of duration of vitamin D supplementation on quartiles of well-being scores obtained during winter 2002–2003. The boxes with solid perimeters indicate new, Study-2 patients; the boxes with dashed-line perimeter indicate patients who had been consuming their vitamin D since December the previous year (from Study 1). Shaded boxes indicate the data for February, 2002. Spearman's non-parametric correlation of well-being vs months was significant and negative with the higher dose (p = 0.002), but the correlation was not significant for the lower dose (p = 0.108). Statistical comparisons among these data are presented in Table 2.

