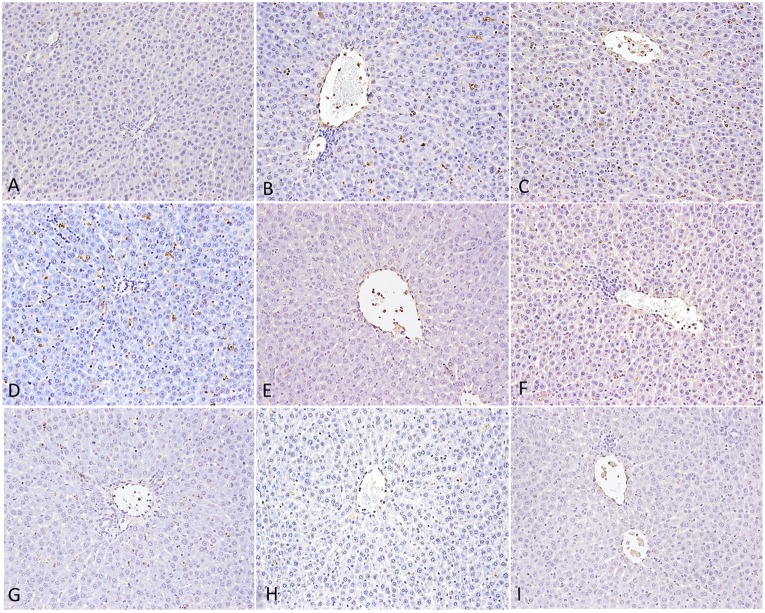
FIGURE 6.
Hepatocyte apoptosis in rat by TUNEL assay. (A) Control group (Ctr), (B) LPS model group (LPS), (C) PM treated with LPS group (LPM), (D) High dose of Poria treated with LPS group (LHP), (E) Middle dose of Poria treated with LPS group (LMP), (F) Low dose of Poria treated group with LPS (LLP), (G) PM + high dose of Poria co-treated with LPS group (LPHP), (H) PM + middle dose of Poria co-treated with LPS group (LPMP), (I) low dose of Poria co-treated with LPS group (LPLP). Liver sections were collected at 7 h after LPS tail intravenously.

