
Fig. 2.
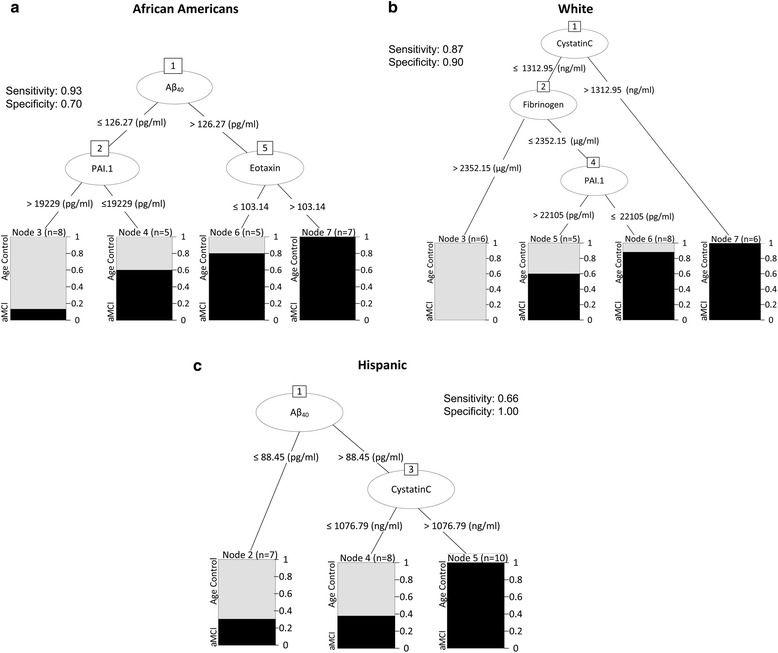
Decision tree models for each ethnic group represent biomarkers linked to the risk of developing AD. Each node represents the subgroups of patients obeying the rule of similar biomarker levels linked to the probability of developing aMCI for the given sample size. The sensitivity and specificity for each decision tree was determine