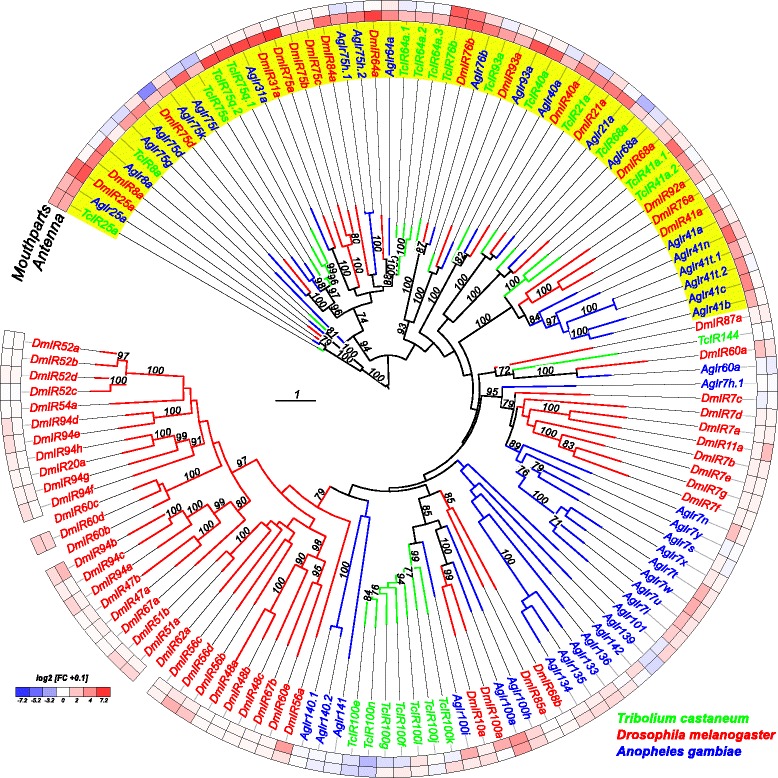
Fig. 8.

Phylogenetic tree of IRs. Based on protein sequences from T. castaneum (green branches), D. melanogaster (red branches), and An. gambiae (blue branches). The tree was rooted using the IR8/IR25 clade, according to [114]. Robustness of the tree topology was evaluated by 100 rapid bootstrap replications. Outer rings represent the expression in antennae and mouthparts (T. castaneum: palps, mandible, labrum, and labium; D. melanogaster: palp and proboscis; An. gambiae: maxillary palp) as log2-fold change compared to body corresponding to the scale in the left lower corner. The scale bars within the trees represent one amino acid substitution per site. Antennal IRs are highlighted in yellow. Basically the same figure is available with absolute values instead of fold changes to get an impression of the tissue-specific abundance of the transcripts as Additional file 10: Figure S6. IR ionotropic glutamate-like receptor
