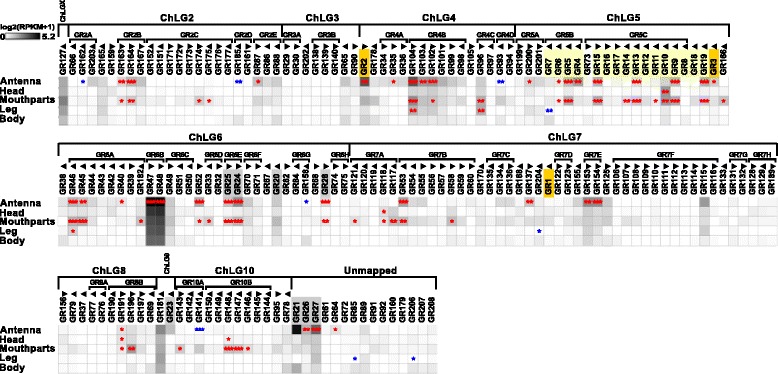
Fig. 9.

Expression of T. castaneum gustatory receptors (GRs). Heat map showing the expression level of the 207 analyzed GRs as a log2[RPKM + 1] value in different tissues [adult antennae, head (missing antennae but including mouthparts), mouthparts, legs, and body]. The candidates are ordered according to their chromosomal localization (Additional file 11: Figure S7b). Horizontal brackets above indicate clustering in the genome. The arrowheads represent the orientation of the open reading frame. The expression levels are represented by a greyscale with the highest shown expression levels labeled black. The asterisks mark statistically significantly differentially expressed genes compared to body (based on biological replicates of five antennal, two head, three mouthpart, two leg, and two body samples). The red asterisks represent up- and the blue down-regulation (p values adjusted are * < 0.05, ** < 0.01, and *** < 0.001). CO2 receptors are highlighted in orange, fructose receptor related genes in grey, and sugar receptors in yellow. GR gustatory receptor, RPKM reads per kilobase per million,
