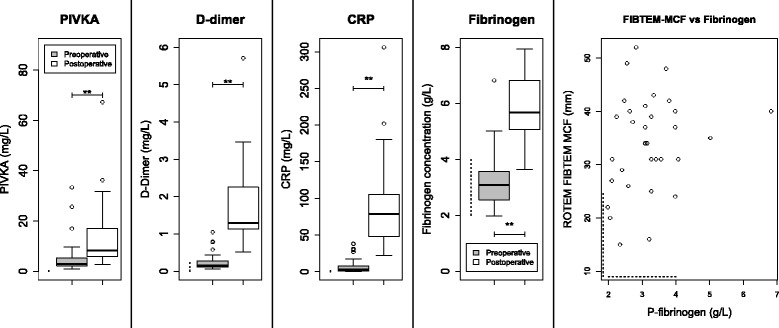
Fig. 4.

Boxplots show pre- to postoperative changes in PIVKA (protein induced by vitamin K absence), D-dimer, CRP and fibrinogen levels. Note the lack of correlation between postoperative fibrinogen and ROTEM® FIBTEM-MCF. Note that two PIVKA outliers (106 and 398 mg/L) lie above the axes’ limits. Dashed lines indicate reference intervals, brackets indicate significant differences between pre- and postoperative results *P < 0.05; **P < 0.01
