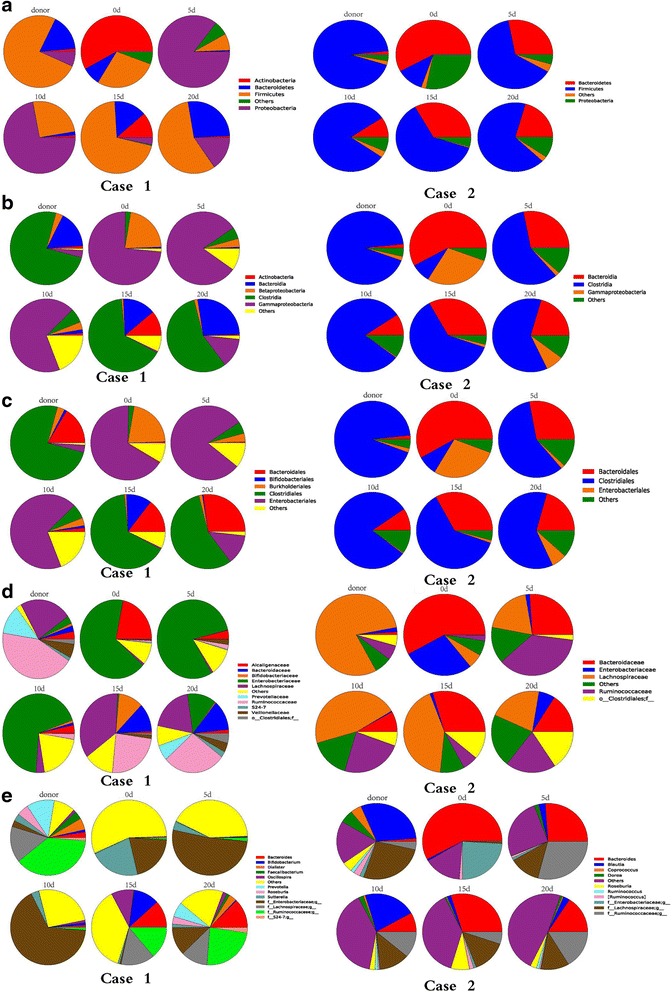
Fig. 2.

Predominant fecal microbiota composition in the donor and patients (case 1 and case 2) at the phyla level (a), the class level (b), the order level (c), the family level (d), and the genus level (e). Variations in the microbiota composition are shown at the representative time points in the days (d) following fecal microbiota transplantation
