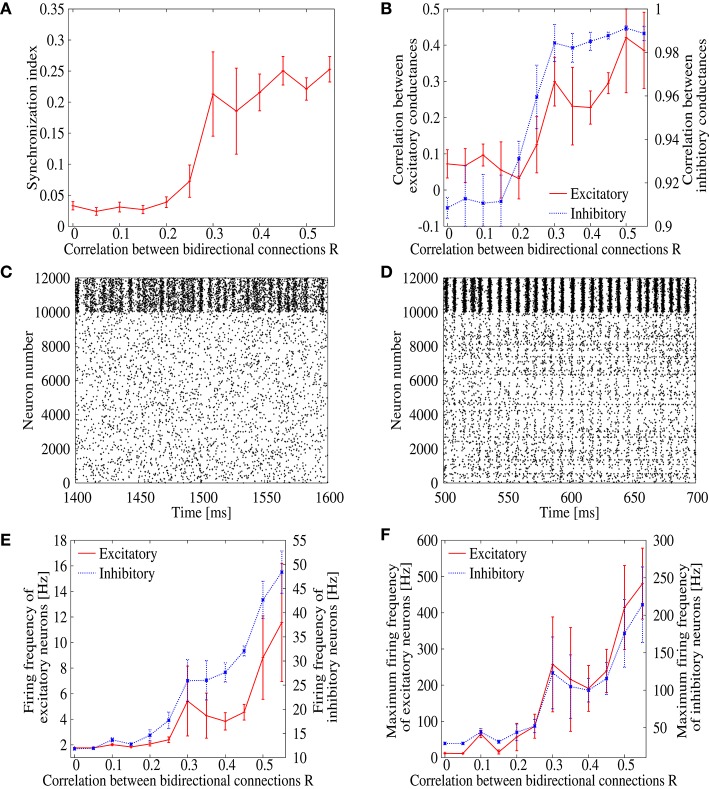
Figure 1.
(A) Dependence of the synchronization index on correlation parameter R, which measures correlation of EPSPs between bidirectionl connections. The error bars indicate standard deviation of 5 realizations started from different random initial conditions. (B) Dependence of the correlation between inhibitory (blue) and excitatory (red) synaptic conductances of excitatory neurons on the correlation parameter R. (C,D) Raster plot representing the firing pattern of R = 0 (C) and R = 0.35 (D). For excitatory neurons, spikes are indicated from neuron number 0 to 9999, whereas they are indicated from neuron number 10, 000 to 11, 999 for inhibitory neurons. (E) Dependence of the mean firing frequencies of excitatory (red) and inhibitory (blue) neurons on the correlation parameter R. (F) Dependence of the maximum firing frequencies of excitatory (red) and inhibitory (blue) neurons on the correlation parameter R.

