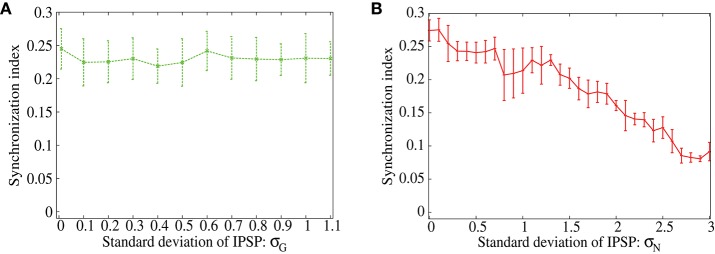
Figure 5.
(A,B) Dependence of the synchronization index between excitatory neurons on standard deviation of the IPSPs. The error bars indicate standard deviation of 5 realizations started from different random initial conditions. Frequency of the common inputs is set to 25 Hz. The IPSPs are normally distributed in (A), while they are lognormally distributed in (B).

