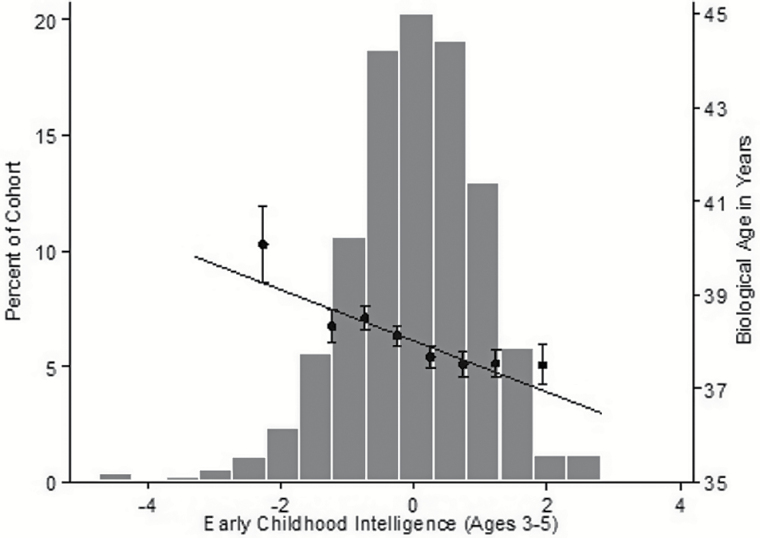
Figure 1.
The association between early childhood intelligence and biological age as measured by the NHANES biomarker algorithm.
The histogram depicts the normal distribution of Study members’ early childhood intelligence scores, whereas the scatter plot and regression line show the association between early childhood intelligence and age 38 biological age as measured by the NHANES biomarker algorithm. The dots and standard error bars show average biological age for Study members with early childhood intelligence scores falling <−1.5, −1.5 to −1, −1 to −0.5, −0.5 to 0, 0–0.5, 0.5–1, 1–1.5, and > 1.5 SDs relative to the mean. NHANES = National Health and Nutrition Examination Survey (III).

