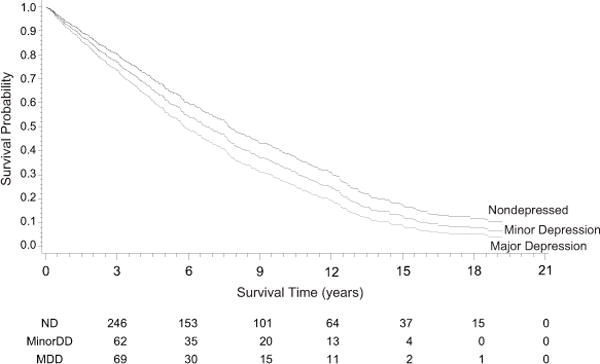
Figure 1. Covariate-adjusted Kaplan-Meier curves of patients with major, minor, or no depressive disorder during the index hospitalization.

ND = not depressed; MinorDD = Minor Depressive Disorder; MDD = Major Depressive Disorder. The numbers of survivors within each diagnostic subgroup are listed by quarter below the graph.
