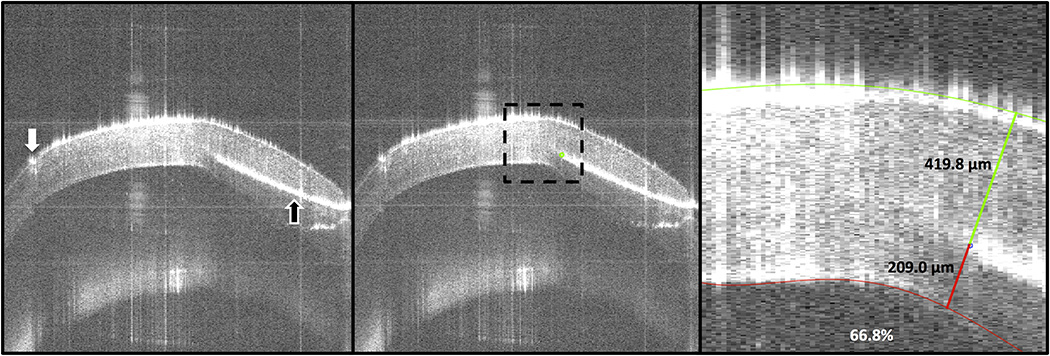
FIGURE 2. Needle depth analysis images for a successful full big bubble (BB) formation group sample.
(Left) The paracentral cornea B-scan with the needle (black arrow) tip was selected from the swept-source microscope-integrated optical coherence tomography (SS-MIOCT) volume immediately prior to air injection. The trephination groove (white arrow) could also be visualized. (Center) The needle tip (green dot) was manually segmented and the cornea was cropped to the region of interest (dotted-black box). (Right) The epithelial and endothelial surfaces were semi-automatically segmented. The stroma above the needle (419.8 µm), the stroma below the needle (209.0 µm), and the needle depth percentage (66.8%) were then calculated (numbers refer only to results from this image). The central corneal thickness of this cornea was 501.0 µm.

