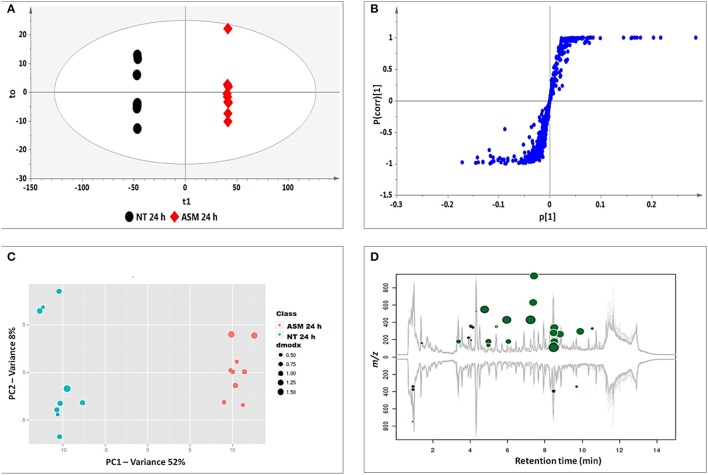
Figure 3.
Identification of discriminatory biomarkers: OPLS-DA (A,B) and XCMS (C,D) comparing the 24 h ASM-treated vs. 24 h non-treated tobacco cells. (A) The OPLS-DA score plot and (B) the corresponding S-plot show the different clustering of treated and non-treated samples. The ellipse represents Hoteling's T2 with 95% confidence and the model calculated PCs and yielded R2X = 74.4%, R2Y = 99.9%, and Q(cum) = 99.8%. Model validation by CV-ANOVA showed high model significance with p = 2.01 × 10⁻¹⁷. (C) The XCMA PCA score plot of treated vs. non-treated cells processed by using unit variance scaling centered based on features intensity. (D) The Cloud plot of treated vs. non-treated cells showing data set of 35 features with p ≤ 0.01 and fold change ≥1.5.

