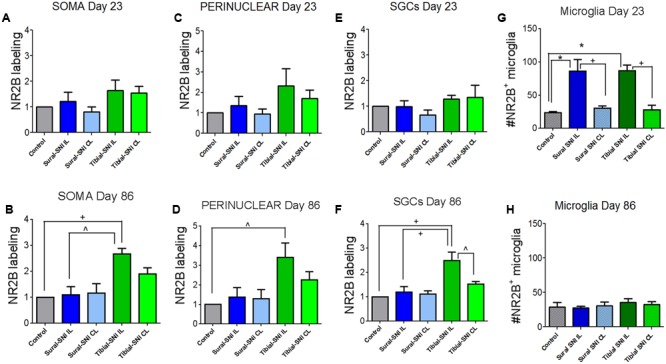
FIGURE 5.

Quantification of NR2B labeling in various cells in the L3-DRG at Day 23 and Day 86 following surgery. NR2B labeling in the neuronal soma (SOMA) (A,B), the perinuclear area of the neuronal soma (E,C), in SGC (E,F) and in microglia/macrophages (G,H) at Day 23 (A,C,E,G) and Day 86 (B,D,F,H) following surgery. For Day 23 (A,C,E,G): the control group n = 6 rats (three sham, three naïve). For each control rat measurements were done in the IL and CL L3-DRG. Measurements were done in on average in 198 somas/rat (A); on average in 198 perinuclear areas/rat (C); on average in 120 SGCs/rat (E). For the other four groups (Sural-SNI-IL, Sural-SNI-CL, Tibial-SNI-L, and Tibial-SNI-CL) n = 3 rats. The “average number of somas/rat-area” measured were 116, 101, 111, 109 for Sural-SNI-IL, Sural-SNI CL, Tibial-SNI IL, and Tibial-SNI CL, respectively. The “average number of perinuclear areas/rat-area” measured were 109, 100, 102. 92 for Sural-SNI-IL, Sural-SNI CL, Tibial-SNI IL, and Tibial-SNI CL, respectively. The “average number of SGCs/rat-area” measured were 72, 62, 66, 60 for Sural-SNI-IL, Sural-SNI CL, Tibial-SNI L, and Tibial-SNI CL, respectively. For Day 86 (B,D,F,H): the control group n = 4 rats (two sham, two naïve). For each control rat measurements were done in the IL and CL L3-DRG. Measurements were done in on average in 256 somas/rat (B); on average in 257 perinuclear areas/rat (D); on average in 360 SGCs/rat (F). For the other four groups (Sural-SNI-IL, Sural-SNI-CL, Tibial-SNI-L, and Tibial-SNI-CL) n = 3 rats. The “average number of somas/rat” measured were 148, 124,122, and 166 for Sural-SNI-IL, Sural-SNI CL, Tibial-SNI IL, and Tibial-SNI CL, respectively. The “average number of perinuclear areas/rat” measured were 148, 137,143, and 190 for Sural-SNI-IL, Sural-SNI CL, Tibial-SNI IL, and Tibial-SNI CL, respectively. The “average number of SGCs/rat” measured were 270, 154, 209, and 256 for Sural-SNI-IL, Sural-SNI CL, Tibial-SNI L, and Tibial-SNI CL, respectively. (G,H) Number of microglia/macrophages that were NR2B positive/324,000 μm2. The n = 6 and 4 rats for Day 23 and Day 86, respectively; and n = 3 rats for all the other groups. In all panels: mean + sem. For (A–F), the data was normalized to control values. One-way ANOVA, with Tukey’s multiple comparison test. ∗p < 0.001, +p < 0.01, ˆp < 0.05.
