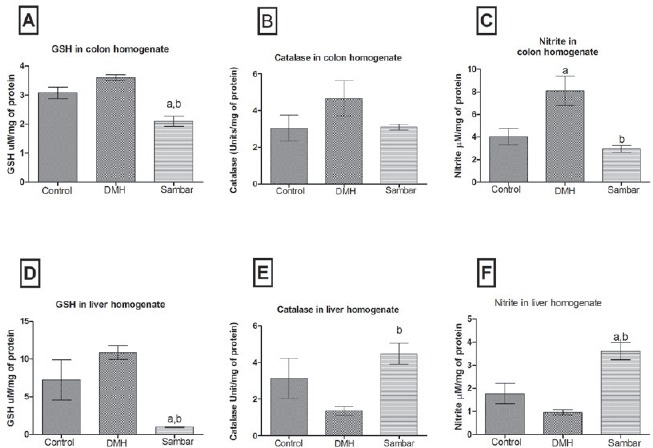
Figure 4.

Glutathione (A), catalase (B), and nitrite (C) levels in the colon homogenate of the various groups. Glutathione (D), catalase (E), and nitrite (F) levels in the liver homogenate of the various groups. aP < 0.05 versus control and b P < 0.05 versus DMH. Data is represented as mean ± SEM of six values
