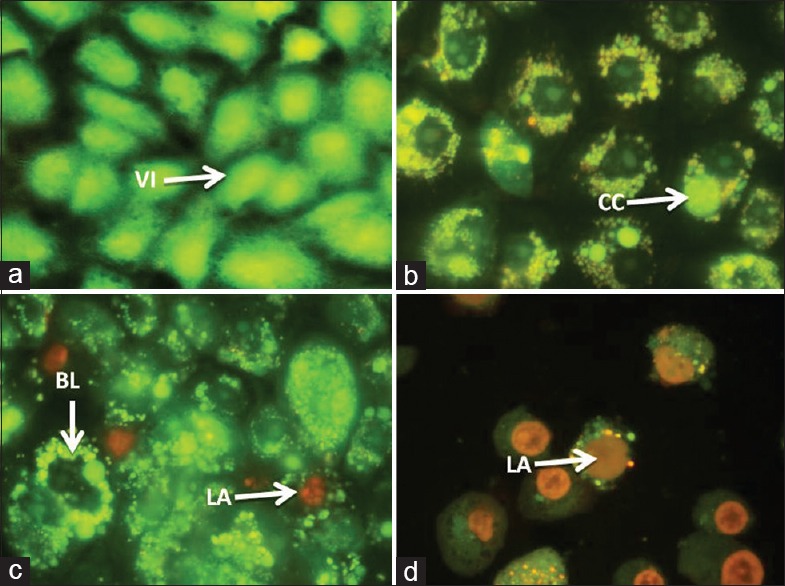
Figure 4.

Fluorescent micrographs of acridine orange/ethidium bromide double stained Madin-Darby Bovine Kidney cells treated with khat extract for 24 h. Untreated cells shows normal structure without prominent apoptosis and necrosis (bright green) (a). Early apoptosis features seen after 1.5 mg treatment (bright green) (b) and blebbing (bright green) were noticed in 2.5 mg treatment (orange color) (c and d). VI: Viable cells; BL: Blebbing of the cell membrane; CC: Chromatin condensation; LA: Late apoptosis (×400). Each experiment was performed in triplicate
