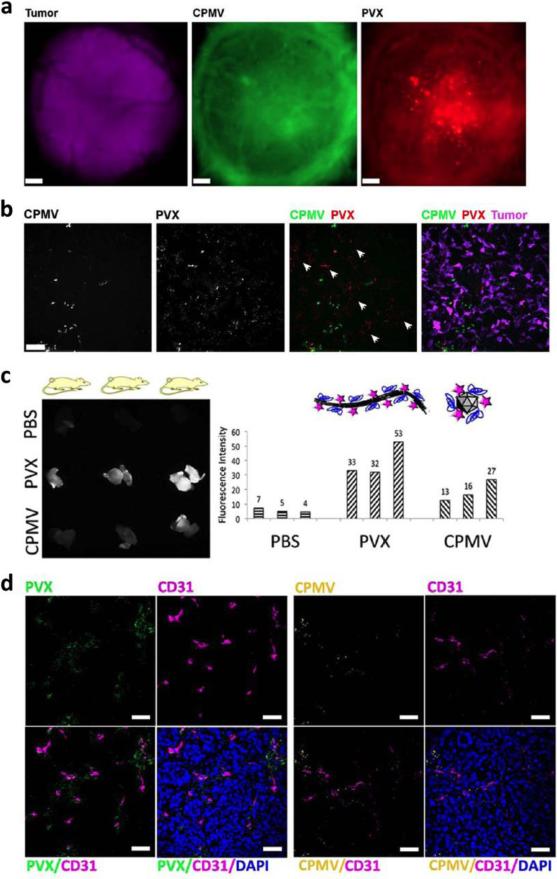
Figure 7. Imaging of tumor uptake and distribution of CPMV and PVX.
a) Comparison of icosahedral CPMV (green) and filamentous PVX (red) distribution when coinjected in a CAM model of chick embryos prepared with vascularized GFP-expressing human fibrosarcoma HT1080 or human epithelial carcinoma HEp3 tumors (magenta), with PVX better able to penetrate to the tumor core. Scale bar = 190 μm. b) Fluorescence microscopy of 8 μm tumor sections showing CPMV having limited distribution, while PVX is spread throughout the tumor and found in areas devoid of CPMV (white arrowheads). c) Image of tumors from an HT-29 colon cancer mouse xenograft model after intravenous injection of CPMV and PVX particles (left) and quantitation of fluorescence intensity (right). d) Immunofluorescence staining of 10 μm tumor sections showing CPMV (pseudocolored in yellow) remaining close to the endothelium (stained with FITC-labeled CD31 antibody pseudocolored in pink) and PVX (pseudocolored in green) having better tissue penetration properties. Nuclei were stained with DAPI (blue). Scale bars are 30 μm. Reproduced with permission from ref. 143. Copyright 2012 American Chemical Society.

