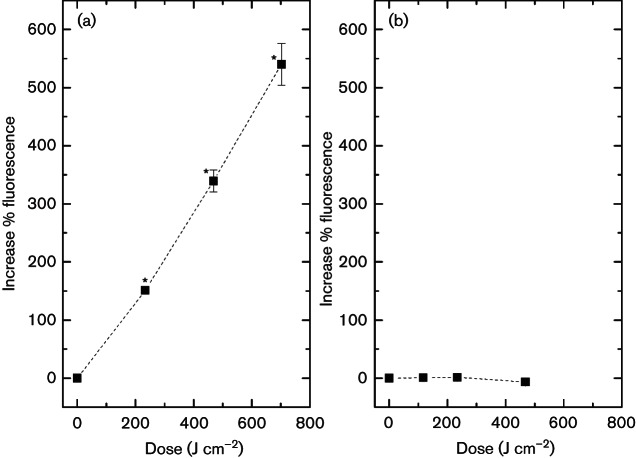
Fig. 4.
SYTOX green fluorescence at 523 nm of (a) E. coli and (b) S. aureus cells following increasing doses of 405 nm light exposure (65 mW cm−2), using an excitation wavelength of 490 nm. Results are measured as the percentage increase compared to non-exposed control samples. An asterisk (*) represents a significant increase in fluorescence when compared to non-exposed control samples (P≤0.05). Each data point is a mean value±sem (n≥3).

