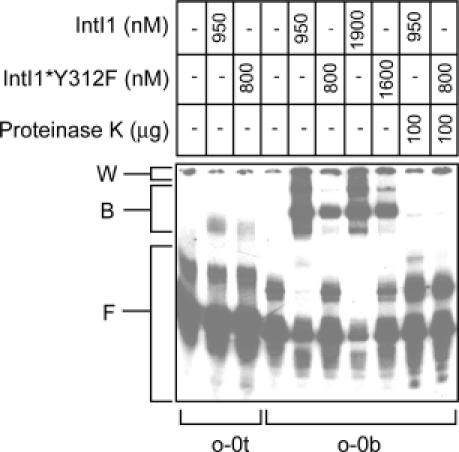
Figure 6.

Gel retardation assay for comparing the binding of wild-type IntI1 versus IntI1*Y312F to top- and bottom-strand oligomers of attC. In the two lanes furthest right the effect of proteinase K treatment was investigated. Proteins and concentrations used are shown. The single-stranded oligomers o-0t and o-0b were labelled with 32P and used at a concentration of 8 and 12 nM respectively, corresponding to ∼250 c.p.s. per binding mixture. For more details and abbreviations, see Material and Methods. B, protein–DNA complexes; F, free DNA; W, aggregated DNA that remained in the wells.
