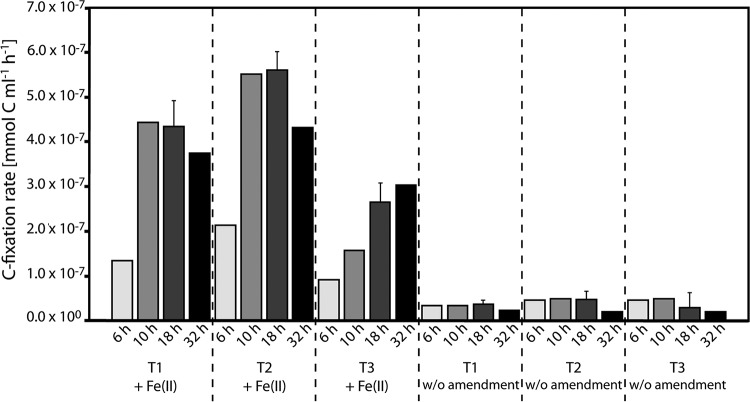
FIG 5.
C fixation rates measured in mini-microcosms during three time intervals in phase 2 of the experiment. Rates from incubations where Fe(II) was added (NO3− was still present after preincubation) are shown on the left. Rates from incubations where no Fe(II) was added and also no consumption of NO3− was observed over time (NO3− was still present after preincubation) are shown on the right. Error bars show standard deviations of data for three samples (available for the 18-h samples only).

