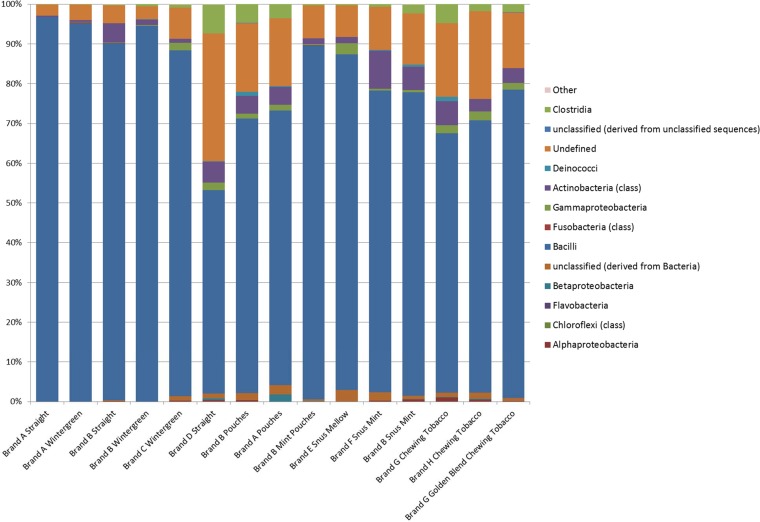
FIG 3.
Cumulative pyrosequencing results for the V1/V2 region of the 16S rRNA analysis of each of the different types of smokeless tobacco samples analyzed. The bar graph indicates the percentages of sequences detected that belonged to a particular bacterial class. The classes of organisms and color schemes are presented on the right side of the figure. The data corresponding to the DNA sequences identified as chloroplasts have been removed due to their likely representing plant origins rather than microbial populations.

