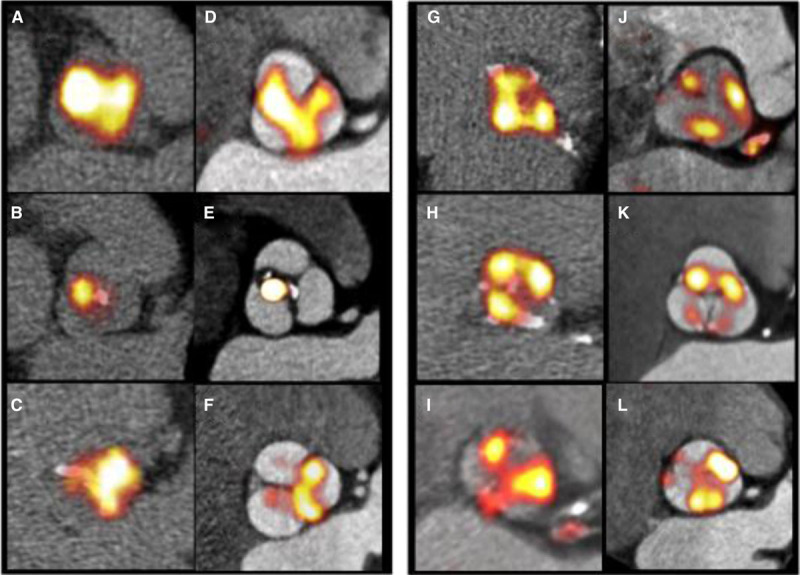
Figure 2.

Improved localization of positron emission tomography (PET) signal within the aortic valve and its leaflets. Paired nongated, noncontrast PET/computed tomography (CT) scans (original approach A–C and G–I) and gated, contrast-enhanced PET/CT images (final approach D–E and J–L). Images demonstrate the typical distribution of the tracer uptake within the valve at sites of increased mechanical stress, that is, at the leaflet tips (left: A–F) and at the commissures (right: G–L).
